

DOI: 10.5281/zenodo.23678641 · UDC: 616.153.922:616.441-008.64
Objectives. Autoimmune hypothyroidism is associated with disturbances in lipid metabolism. This study assessed lipid profiles and cardiovascular risk markers in patients with overt (OH) and subclinical hypothyroidism (SH) compared with healthy controls, and examined lipid changes during levothyroxine treatment.
Methods. This observational case–control study included 129 adults: 65 patients with autoimmune hypothyroidism (35 OH, 30 SH) and 64 controls. All patients had complete lipid, TSH, and fT4 measurements at baseline, 8 weeks, and 16 weeks. Lipid indices included LDL cholesterol (LDL-c), HDL cholesterol (HDL-c), non-HDL cholesterol (non-HDL-c), and the total cholesterol/HDL-c ratio. Between-group comparisons and paired longitudinal tests were performed; longitudinal p values were not adjusted for multiple comparisons.
Results. Baseline LDL-c was higher in patients than controls (3.96 ± 1.67 vs 3.39 ± 0.76 mmol/L; p = 0.015). Non-HDL-c was higher in OH than SH (5.31 ± 2.19 vs 3.64 ± 0.96 mmol/L), and the total cholesterol/HDL-c ratio was higher in patients than controls (4.16 ± 1.59 vs 3.42 ± 0.75; p = 0.001). At 16 weeks, mean LDL-c decreased from 3.96 ± 1.67 to 3.28 ± 1.00 mmol/L (p = 0.001), and non-HDL-c from 4.54 ± 1.92 to 3.68 ± 1.17 mmol/L (p < 0.001). HDL-c did not improve significantly. At week 16, TSH was within the reference interval in 42 of 65 patients (64.6%).
Conclusions. Overt autoimmune hypothyroidism was associated with a more atherogenic lipid profile than SH or euthyroid status. During levothyroxine treatment, LDL-c and non-HDL-c improved, particularly in OH, while HDL-c did not. These observational findings do not establish a causal treatment effect or a reduction in cardiovascular events.
Obiective. Hipotiroidismul autoimun se asociază cu modificări ale metabolismului lipidic. Studiul a evaluat profilul lipidic și markerii riscului cardiovascular la pacienții cu hipotiroidism manifest (OH) și subclinic (SH), comparativ cu subiecți sănătoși, precum și modificările lipidice în timpul tratamentului cu levotiroxină.
Metode. Studiul observațional caz-control a inclus 129 de adulți: 65 de pacienți cu hipotiroidism autoimun (35 OH, 30 SH) și 64 de subiecți control. Toți pacienții au avut determinări complete ale parametrilor lipidici, TSH și fT4 la momentul inițial, la 8 și la 16 săptămâni. Au fost analizați LDL-colesterolul (LDL-c), HDL-colesterolul (HDL-c), colesterolul non-HDL (non-HDL-c) și raportul colesterol total/HDL-c. Au fost efectuate comparații între grupuri și teste perechi longitudinale; valorile p longitudinale nu au fost ajustate pentru comparații multiple.
Rezultate. Valoarea inițială a LDL-c a fost mai mare la pacienți decât la controale (3,96 ± 1,67 față de 3,39 ± 0,76 mmol/L; p = 0,015). Non-HDL-c a fost mai mare în OH decât în SH (5,31 ± 2,19 față de 3,64 ± 0,96 mmol/L), iar raportul colesterol total/HDL-c a fost mai mare la pacienți decât la controale (4,16 ± 1,59 față de 3,42 ± 0,75; p = 0,001). La 16 săptămâni, media LDL-c a scăzut de la 3,96 ± 1,67 la 3,28 ± 1,00 mmol/L (p = 0,001), iar non-HDL-c de la 4,54 ± 1,92 la 3,68 ± 1,17 mmol/L (p < 0,001). HDL-c nu s-a ameliorat semnificativ. La săptămâna 16, TSH se afla în intervalul de referință la 42 dintre cei 65 de pacienți (64,6%).
Concluzii. Hipotiroidismul autoimun manifest s-a asociat cu un profil lipidic mai aterogen decât forma subclinică sau statusul eutiroidian. În timpul tratamentului cu levotiroxină, LDL-c și non-HDL-c s-au ameliorat, în special în OH, spre deosebire de HDL-c. Rezultatele observaționale nu demonstrează un efect cauzal al tratamentului sau reducerea evenimentelor cardiovasculare.
Hypothyroidism is a condition characterized by insufficient production of thyroid hormones and is among the most prevalent endocrine disorders [1]. Subclinical hypothyroidism is primarily identified through laboratory findings (elevated TSH with normal thyroid hormone levels) in the absence of overt symptoms, and the majority of cases are due to autoimmune thyroiditis (Hashimoto’s disease) [2]. Both overt (OH) and subclinical hypothyroidism (SH) have been associated with an unfavorable cardiovascular risk profile. SH may be linked to a higher incidence of ischemic heart disease, heart failure, and hypercholesterolemia, as well as other risk factors for cardiovascular disease (CVD) [3-6]. Thyroid hormones play a crucial role in regulating lipid metabolism, influencing cholesterol synthesis, absorption, and clearance [1]. Consequently, thyroid dysfunction, especially OH, is often accompanied by significant dyslipidemia, characterized by elevated TC and LDL-c levels [5,6]. This lipid disturbance contributes to a pro-atherogenic state, suggesting the need for frequent monitoring and timely intervention in hypothyroid patients. Recent research highlights the utility of non-HDL cholesterol and the ratio of total-to-HDL cholesterol as better predictors of CVD risk than traditional lipid measures alone [7-9]. These indices do not require fasting samples and have been incorporated into risk estimation models for both middle-aged and older populations. Early identification of dyslipidemia in hypothyroid patients, particularly in women in early middle age (who are more prone to autoimmune thyroid disease but otherwise relatively cardioprotected by estrogen), is important for preventing future cardiovascular events [10-12]. This study was designed to assess lipid profile patterns and cardiovascular risk factors in patients with autoimmune hypothyroidism (both OH and SH) compared to healthy controls, and to evaluate the effect of levothyroxine (L-T4) replacement therapy on the lipid parameters. We specifically aimed to correlate thyroid function markers with lipid levels and to determine whether treating mild thyroid failure (SH) yields improvement in atherogenic lipid profiles. By doing so, we sought to clarify the cardiovascular risk implications of autoimmune hypothyroidism and inform appropriate clinical management strategies [9].
We conducted an observational case-control study with a prospective follow-up conducted in the patient group, of 129 adult participants, comprising 65 patients with autoimmune hypothyroidism and 64 healthy controls. Patients were recruited from district- and municipal-level outpatient centers and from the republican consultative department of the Public Medical-Sanitary Institution Republican Clinical Hospital “Timofei Moșneaga“. Patients were recruited consecutively when they presented with signs or symptoms suggestive of hypothyroidism and had laboratory confirmation of thyroid dysfunction. A 16-week follow-up period was selected to allow achievement of a steady state after dose adjustment and stabilization of the lipid profile. Healthy control subjects were recruited from the community, and were frequency-matched to the hypothyroid group by age and sex. Of the hypothyroid patients initially identified, 6 were subsequently excluded: refusal to participate (n=2), development of an acute inflammatory process (n=2), loss to follow-up (n=1), and missing data (n=1), leaving the final analytic cohort of 65 patients (35 OH, 30 SH) reported here. The collection of primary data took place between 2019 and 2024 and the study was conducted under the positive approval of the Research Ethics Committee of ”Nicolae Testemitanu” State University of Medicine and Pharmacy, Chisinau, Republic of Moldova (minutes/protocol No. 3/5, dated 15.03.2019). All participants were informed about the study's purpose and procedures and signed a written informed consent form before enrollment, in accordance with the principles of the Declaration of Helsinki.
All 65 patients in the final analytic cohort (OH, n = 35; SH, n = 30) had lipid, TSH, and fT4 measurements at baseline, week 8, and week 16. One patient with missing data had been excluded before formation of the final cohort. Longitudinal analyses were based on complete cases; no imputation was performed.
The sample-size calculation was based on the comparison of two independent groups (patients with autoimmune hypothyroidism versus healthy controls):
n = 2 (Z1−α/2 + Z1−β)2 / d2
where Z1−α/2 = 1,96; Z1−β = 0,84; d = 0,50.
n = 2 × (1,96 + 0,84)2 / 0,502 = 2 × 7,84 / 0,25 = 62,72 ≈ 63 participants per group.
The inclusion criteria for the hypothyroid group were: newly diagnosed untreated primary hypothyroidism with positive anti-thyroid antibodies (anti-TPO and/or anti-TG), indicating autoimmune thyroiditis. The exclusion criteria for all groups included: euthyroid autoimmunity, prior or current thyroid hormone treatment, use of any medications affecting thyroid function (e.g. amiodarone, lithium) or lipid metabolism (e.g. statins), and the presence of comorbidities that could influence lipid levels (such as diabetes mellitus, chronic kidney disease, uncontrolled hypertension, or active liver disease). Individuals with obesity (body mass index >35 kg/m2) were excluded. None of the participants had a history of smoking or established cardiovascular disease at baseline. By excluding those with substantial confounding conditions, the study aimed to isolate the impact of thyroid dysfunction on the lipid profile.
Clinical and Laboratory Assessments
Detailed medical history and anthropometric data were obtained from each subject. Weight and height were measured to calculate body mass index (BMI). Venous blood samples were drawn after an overnight fast of at least 8 hours for biochemical analyses. Overt primary hypothyroidism was diagnosed based on a serum TSH level >10 µIU/mL accompanied by a free T4 (fT4) concentration below the reference range. Subclinical hypothyroidism was defined as an elevated TSH (above the reference range of 4.0 µIU/mL) with fT4 within the normal range. In all patients, the hypothyroid status was of autoimmune etiology, confirmed by elevated titres of anti–thyroid peroxidase antibodies (anti-TPO Ab and/or anti–thyroglobulin antibodies (anti-TG Ab). We used a two-step confirmation for subclinical cases: if a patient’s initial TSH was elevated (>4 µIU/mL) but <10 µIU/mL with normal fT4, the test was repeated after an interval of at least 4 weeks to confirm persistent TSH elevation before classifying as SH. All thyroid-related analytes (TSH, fT4, free T3 (fT3), anti-TPO Ab, and anti-TG Ab) were measured using a direct chemiluminescent immunoassay (Immulite 2000, Siemens Healthcare, USA). Reference intervals were: TSH 0.4–4.0 µIU/mL; fT4 0.69–1.7 ng/dL; fT3 2.0–4.4 pg/mL; anti-TPO Ab <10 IU/mL, and anti-TG Ab <20 IU/mL. Fasting lipid parameters were measured for all participants. TC, LDL cholesterol, and HDL-c were determined by enzymatic colorimetric methods using a DxC 700 AU analyzer (Beckman Coulter, USA), with the following reference values for optimal levels: TC <5.2 mmol/L, LDL-c <2.6 mmol/L, HDL-c ≥1.55 mmol/L. Non-HDL-c was calculated as the difference between TC and HDL-c. A non-HDL-c value <3.37 mmol/L was considered optimal. We also computed the TC/HDL-c ratio for each participant as an index of atherogenic risk; a TC/HDL-c ratio ≥4 is often regarded as elevated risk, with <3 being optimal. We obtained a complete blood count (CBC) and erythrocyte sedimentation rate (ESR) to screen for any systemic inflammation or other blood test abnormality. Serum creatinine and estimated glomerular filtration rate (GFR) were measured to ensure normal renal function. All measurements were performed using standard laboratory methods and calibrated instruments (e.g., CBC by flow cytometry on Sysmex XT-2000i, ESR by Westergren method on Diesse Cube 30). Quality control was maintained throughout the analyses.
In our study, the levothyroxine starting dose varied according to body weight and TSH level. In patients with OH, the starting dose was 1.6 µg/kg body weight/day; in patients with TSH between 10 and 19.9 µIU/mL – 1.2 µg/kg body weight/day; and in those with TSH between 4.1 and 9.9 µIU/mL – 0.7 µg/kg body weight/day. Clinical and hormonal reassessment was performed after 8 and 16 weeks of levothyroxine treatment, respectively. Dose adjustment was made as needed, based on the TSH value. The goal of treatment was normalization of TSH.
Statistical Analysis
All longitudinal comparisons in Table 3 used two-sided paired-samples t tests; Wilcoxon signed-rank tests were used as sensitivity analyses. No omnibus repeated-measures test across the three visits was performed. The longitudinal p values are unadjusted for multiple comparisons. Bonferroni adjustment was applied only to post hoc comparisons among the three study groups and pairwise comparisons of proportions. Accordingly, individual longitudinal p values should be interpreted as exploratory.
Quantitative variables were analyzed using parametric tests (ANOVA, F test) and the non-parametric Kruskal–Wallis test. Levene’s test was used to assess equality of variances. The effect of the treatment was assessed using the paired t-test and the Wilcoxon signed-rank test. Proportions were analyzed using χ2 test with Bonferroni correction for multiple comparisons. Pearson's correlation test (r) was applied to analyze the associations between numerical variables. The significance level applied was p < 0.05. For estimation of effect size Cohen's d was calculated. Statistical processing was performed using MS Excel, PSPP 2.0.1 (GNU PSPP Statistical Analysis Software, Release 2.0.1, Boston, MA: Free Software Foundation), and IBM SPSS Statistics (Version 29).
The study included a total of 129 participants. The study group (L1) comprised 65 individuals diagnosed with autoimmune hypothyroidism, while the control group (L0) consisted of 64 healthy subjects. The two groups were comparable in terms of age and sex distribution. In L1, 55 participants were women (84.6%) and 10 were men (15.4%), whereas in L0, 53 were women (83%) and 11 were men (17%). The mean age was 41.3 ± 13.4 years in L1 and 41.7 ± 6.6 years in L0. In the hypothyroid group (L1), the hormonal profile showed a markedly elevated mean TSH level of 50.59 ± 63.82 µIU/mL, accompanied by reduced free T4 (0.66 ± 0.34 ng/dL) and free T3 levels (2.47 ± 1.11 pg/mL). Anti-TPO Ab levels were substantially increased (635.05 ± 447.89 IU/mL). In contrast, the control group exhibited normal thyroid function, with a mean TSH of 1.80 ± 0.66 µIU/mL and anti-TPO antibody levels of 19.28 ± 32.15 IU/mL. Differences in TSH (F=37.4, p<0.001) and anti-TPO antibody levels between the two groups were statistically significant (F=120.4, p<0.001). Patients with autoimmune hypothyroidism demonstrated an overall more atherogenic lipid profile compared to controls. The mean TC level was higher in L1 than in L0 (6.07 ± 2.10; 95 % CI 5.54-6.59 vs 5.54 ± 1.01 mmol/L; 95 % CI 5.29-5.80), although this difference did not reach statistical significance (F = 3.20, p=0.076). Mean LDL-c levels were significantly elevated in L1 compared to L0 (3.96 ± 1.67; 95 % CI 3.55-4.37 vs 3.39 ± 0.76 mmol/L; 95 % CI 3.20-3.58; F = 6.12, p=0.015). Mean HDL-c levels were lower in L1 than in controls (1.53 ± 0.46; 95 % CI 1.41-1.64 vs 1.66 ± 0.31 mmol/L; 95 % CI 1.58-1.73), showing a trend toward significance (F=3.60, p=0.061). Non-parametric analysis revealed a statistically significant difference in median HDL-c values between groups (1.49 mmol/L in L1 vs 1.69 mmol/L in L0; KW = 6.57, df=1, p=0.010). Correlation analysis of TC demonstrated positive and negative associations with several clinical and biochemical indices, as detailed in Table 1.
| r | p | |
|---|---|---|
| TSH | 0,35** | 0,004 |
| fT4 | -0,51** | <0,001 |
| fT3 | -0,58** | <0,001 |
| Creatinine | 0,32 ** | 0,005 |
| CK | 0,25* | 0,042 |
| HDL-c | 0,42 ** | <0,001 |
| LDL-c | 0,94 ** | <0,001 |
| Non-HDL-c | 0,97** | <0,001 |
| Fibrinogen | -0,27* | 0,029 |
| ESR | 0,39** | 0,001 |
Note: The data is represented in correlation coefficient (r). **Correlations are significant at the 0.01 level. *Correlations are significant at the 0.05 level.
LDL-c showed positive correlations with age (r =0.25, p<0.01), BMI (r = 0.36, p<0.001), TSH (r =0.41, p<0.001), serum creatinine (r = 0.41, p<0.001), and ESR (r = 0.46, p < 0.001). Negative correlations were observed between LDL-c and free thyroid hormones, including fT4 (r = –0.53, p <0.001) and fT3 (r = –0.56, p<0.001). HDL-c demonstrated positive correlations with TC (r=0.43, p<0.001), non-HDL-c (r=0.20, p<0.05) and negative correlations were identified between HDL-c and BMI (r = –0.30, p=0.001), serum creatinine (r = –0.23, p<0.01), and fT3 (r = –0.28, p<0.05).
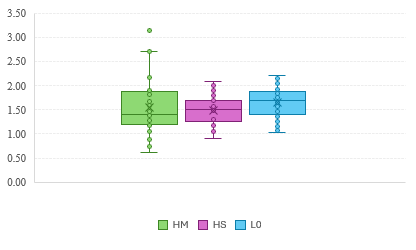
Given the observed heterogeneity in lipid parameters, further analysis was conducted by separating patients with overt and subclinical hypothyroidism. Statistically significant differences in TC and LDL-c levels were observed between the OH subgroup and the control group, as well as between OH and SH. No statistically significant differences in lipid parameters were identified between the SH subgroup and controls (Table 2).
| Lipid Profile Indices | Statistical Indicators | OH (n = 35) | SH (n = 30) | Control (n = 64) | p |
|---|---|---|---|---|---|
| Total Cholesterol | Mean | 6.87 | 5.13 | 5.54 | < 0.001* < 0.001** |
| Standard Deviation | 2.45 | 1.02 | 1.01 | ||
| Median | 6.30 | 5.17 | 5.63 | ||
| Percentile 25 | 5.12 | 4.66 | 4.92 | ||
| Percentile 75 | 8.24 | 5.80 | 6.21 | ||
| 95 % CI | 6.02-7.71 | 4.75-5.51 | 5.29-5.80 | ||
| LDL cholesterol | Mean | 4.56 | 3.26 | 3.39 | < 0.001* < 0.001** |
| Standard Deviation | 1.96 | 0.83 | 0.76 | ||
| Median | 4.31 | 3.13 | 3.47 | ||
| Percentile 25 | 3.02 | 2.82 | 2.95 | ||
| Percentile 75 | 6.20 | 3.77 | 3.77 | ||
| 95 % CI | 3.89-5.24 | 2.95-3.56 | 3.20-3.58 | ||
| HDL cholesterol | Mean | 1.56 | 1.50 | 1.66 | 0.143 |
| Standard Deviation | 0.57 | 0.30 | 0.31 | ||
| Median | 1.41 | 1.52 | 1.69 | ||
| Percentile 25 | 1.19 | 1.26 | 1.42 | ||
| Percentile 75 | 1.88 | 1.69 | 1.89 | ||
| 95 % CI | 1.36-1.75 | 1.38-1.61 | 1.58-1.74 | ||
| nonHDL cholesterol | Mean | 5.31 | 3.64 | 3.88 | <0.001* <0.001** |
| Standard Deviation | 2.19 | 0.96 | 0.94 | ||
| Median | 4.61 | 3.68 | 3.92 | ||
| Percentile 25 | 3.55 | 3.11 | 3.26 | ||
| Percentile 75 | 6.99 | 4.14 | 4.37 | ||
| 95 % CI | 4,56-6,06 | 3,28-4,00 | 3,65-4,12 |
Note: p<0.001* - compared between OH and control group and p<0.001** - compared between OH and SH.
Median HDL-c levels differed significantly between OH and controls (1.41 vs 1.69 mmol/L; KW= 6.45, df=2, p=0.036). Although HDL-c levels in SH were lower than in controls (1.52 vs 1.69 mmol/L), this difference did not reach statistical significance (p = 0.082) (figure 1).
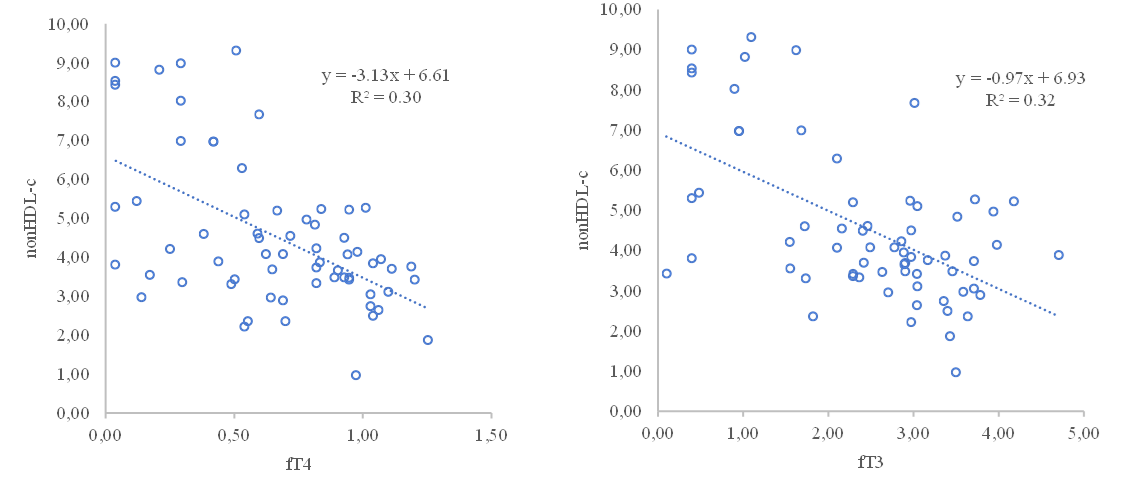
The mean non-HDL-c level was significantly higher in L1 compared to L0 (4.54 ± 1.92; 95% CI 4.06-5.01 vs 3.88 ± 0.94 mmol/L; 95% CI 3.65-4.12; F=6.00, p=0.016). Overall, 75% of individuals with hypothyroidism had non-HDL-c levels exceeding the optimal threshold of 3.37 mmol/L. Within subgroups, non-HDL-c was markedly elevated in OH (5.31 ± 2.19 mmol/L; 95% CI 4.56-6.06) compared to SH (3.63 ± 0.96 mmol/L; 95% CI 3.28-4.00; p<0.05). A statistically significant difference was observed between OH and controls (p<0.001), whereas no significant difference was found between SH and controls. Non-HDL-c levels correlated positively with age (r=0.29, p=0.001), BMI (r=0.37, p<0.001), TSH (r=0.39, p<0.001), serum creatinine (r=0.41, p<0.001), ESR (r=0.42, p=0.001), and anti-TPO Ab (r=0.21, p<0.05), and negatively with fT4 (r = –0.55, p<0.001) and fT3 (r = –0.56, p<0.001) (figure 2).
The TC/HDL-c ratio was significantly higher in the hypothyroid group compared to controls (4.16 ± 1.59; 95% CI 3.76-4.55) vs 3.42 ± 0.75; 95% CI 3.23-3.61; F=11.21, p=0.001). A TC/HDL-c ratio greater than 4 was observed in 45% of L1 participants, compared to 20% in L0. Within subgroups, the mean TC/HDL-c ratio was significantly higher in OH (4.70 ± 1.89; 95% CI 4.06–5.35) than in SH (3.52 ± 0.79; 95% CI 3.22–3.81; p<0.001). Levothyroxine therapy was associated with significant improvements in lipid parameters among patients with overt hypothyroidism. After 16 weeks of treatment, mean TC levels in L1 decreased from 6.07 ± 2.10 (95% CI 5.54-6.59) to 5.16 ± 1.26 mmol/L (95% CI 4.85-5.47) (t=4.19, p<0.001; d=0.53), LDL-c levels declined from 3.96 ± 1.67 (95% CI 3.55-4.37) to 3.28 ± 1.00 mmol/L (95% CI 3.04-3.53) (t=3.46, p=0.001; d=0.49), non-HDL-c levels decreased from 4.54 ± 1.92 (95% CI 4.06-5.01) to 3.68 ± 1.17 mmol/L (95% CI 3.39-3.97) (t=4.44, p<0.001; d=0.49). No statistically significant changes were observed in HDL-c following treatment. The effects of levothyroxine therapy on lipid parameters within the OH and SH subgroups are presented in Table 3.
| Index | OH | SH | ||||||
|---|---|---|---|---|---|---|---|---|
| Before treatment (95% CI) | 8 weeks treatment (95% CI) | 16 weeks treatment (95% CI) | p | Before treatment (95% CI) | 8 weeks treatment (95% CI) | 16 weeks treatment (95% CI) | p | |
| TC | 6.87 ± 2.45(6.02-7.71) | 5.05±1.36 (4.59-5.52) | 5.32±1.50 (4.81-5.83) | <0.001*, † | 5.13±1.02 (4.75-5.51) | 5.29±1.13 (4.87-5.72) | 4.98±0.90 (4.64-5.32) | 0.011‡ |
| LDL-c | 4.56 ± 1.96 (3.89–5.24) | 3.00 ± 0.94 (2.68–3.32) | 3.36±1.1 (2.98-3.75) | <0.001*,<0.005† | 3.26±0.83 (2.95-3.56) | 3.38±1.02 (3.00-3.77) | 3.19±0.84 (2.88-3.51) | 0.103*, 0.543† |
| HDL-c | 1.56±0.57 (1.36-1.75) | 1.32±0.34 (1.20-1.43) | 1.46±0.44 (1.30-1.61) | <0.001*, <0.002‡ | 1.50±0.30 (1.38-1.61) | 1.48±0.27 (1.38-1.58) | 1.51±0.22 (1.43-1.59) | 0.51*, 0.671† |
| Non-HDL-c | 5.31±2.19 (4.56-6.06) | 3.74±1.26 (3.31-4.17) | 3.86±1.33 (3.41-4.32) | <0.001*† | 3.64±0.96 (3.28-4.00) | 3.81±1.08 (3.41-4.22) | 3.47±0.92 (3.13-3.82) | 0.070* 0.144† 0.003‡ |
Note: *Baseline vs week 8; †baseline vs week 16; ‡week 8 vs week 16. P values are from two-sided paired t tests and are unadjusted for multiple longitudinal comparisons; Wilcoxon signed-rank tests were used as sensitivity analyses. Values are mean ± SD (95% CI).
Thyroid function was monitored at all three visits. In the 65 patients, median TSH was 20.80 µIU/mL (IQR, 7.82–75.17) at baseline, 2.76 (IQR, 1.42–5.05) at week 8, and 2.23 (IQR, 1.20–3.46) at week 16; median fT4 was 0.69 ng/dL (IQR, 0.42–0.95), 1.12 (IQR, 1.00–1.34), and 1.21 (IQR, 1.04–1.34), respectively. The authors reported p < 0.001 for both baseline-to-follow-up comparisons of TSH and fT4. At week 16, TSH was within 0.4–4.0 µIU/mL in 42/65 patients (64.6%; OH, 20/35; SH, 22/30), above 4.0 in 14/65 (21.5%), and below 0.4 in 9/65 (13.8%). These findings indicate biochemical improvement, although TSH normalization was not achieved in all patients.
In SH, non-HDL-c increased numerically from baseline to week 8 (p = 0.070), did not differ significantly between baseline and week 16 (p = 0.144), and decreased from week 8 to week 16 (unadjusted p = 0.003). The last comparison should be interpreted cautiously because longitudinal p values were not adjusted for multiple testing.
During follow-up, mean TC, LDL-c and non-HDL-c values decreased from baseline to 16 weeks in the OH subgroup. HDL-c was lower at 8 weeks than at baseline and subsequently increased at 16 weeks, although its 16-week mean remained below baseline. In the SH subgroup, mean LDL-c and HDL-c values changed little, whereas non-HDL-c varied across follow-up assessments (Table 3). These descriptive patterns should be interpreted alongside the reported pairwise comparisons.
Thyroid hormones play a central role in maintaining metabolic homeostasis, and their interaction with lipid metabolism is critical for cardiovascular health [13]. In this study, we evaluated lipid metabolism disorders in patients with autoimmune hypothyroidism, predominantly middle-aged women with Hashimoto’s thyroiditis and without established cardiovascular risk factors such as smoking, hypertension, or diabetes. This allowed a focused assessment of the association between thyroid dysfunction and lipid abnormalities in this selected population. Our findings demonstrate that patients with OH exhibit significantly elevated TC and LDL-c levels compared to both SH and euthyroid controls. The OH group showed a markedly higher mean TC and LDL-c, confirming the proatherogenic lipid profile associated with overt thyroid hormone deficiency. These results are consistent with the known pathophysiological mechanism whereby reduced thyroid hormone levels lead to decreased hepatic LDL receptor expression and impaired clearance of circulating LDL particles [14, 15]. In contrast, lipid alterations in SH were less pronounced. Although a proportion of SH patients demonstrated elevated TC and LDL-c values, no statistically significant differences were observed when compared with the control group. This aligns with previous reports indicating that lipid abnormalities in SH are variable and often modest. Furthermore, the influence of thyroid hormones on HDL-c appears to be less substantial than their effect on LDL-c, as supported by earlier studies reporting minimal or no differences in HDL-c across OH, SH, and euthyroid individuals [16]. In our study, HDL-c levels were lower in OH compared to controls, but no significant differences were observed between SH and control groups.
Beyond conventional lipid parameters, our study highlights the importance of non-HDL cholesterol and the TC/HDL-c ratio as integrated markers of cardiovascular risk. Non-HDL-c levels were significantly higher in patients with OH compared to both SH and controls, and 75% of individuals with hypothyroidism exceeded the optimal non-HDL-c threshold. Similarly, the TC/HDL-c ratio was elevated in OH, with 45% of these patients exhibiting a ratio greater than 4, compared with 20% in the control group, while the optimal value is considered to be below 3 [17]. These findings are consistent with accumulating evidence supporting non-HDL-c and TC/HDL-c ratio as reliable predictors of subclinical atherosclerosis and vascular risk, irrespective of fasting status [18–20]. Their clinical relevance is also supported by contemporary cardiovascular risk models such as SCORE2 and SCORE2-OP, which incorporate total cholesterol and HDL-c together with major clinical risk factors [21, 22]. The pronounced elevation of these indices in OH suggests a substantial atherogenic burden in this subgroup.
Correlation analyses in our study revealed significant associations between lipid parameters and thyroid function markers. TC and LDL-c showed positive correlations with TSH and negative correlations with free thyroid hormones (fT4 and fT3), reinforcing the association between thyroid hormone deficiency and lipid metabolism, which cannot be assumed to be fully independent of potential confounders such as age, sex, and BMI in the absence of multivariable adjustment. LDL-c was also positively correlated with age, BMI, serum creatinine, and inflammatory markers such as ESR, indicating the multifactorial nature of dyslipidemia in hypothyroidism. Non-HDL-c demonstrated similar correlation patterns, with positive associations with age, BMI, TSH, serum creatinine, ESR, and anti-TPO antibody levels, and negative correlations with fT4 and fT3. In separate univariable analyses, the reported coefficients of determination were approximately 0.30 for fT4 and 0.32 for fT3 in relation to non-HDL-c. These associations do not establish an independent causal contribution of thyroid hormone concentrations to lipid abnormalities. A study by Khan et al. found that non-HDL-C significantly correlated with age, total cholesterol, triglycerides, LDL-C, and VLDL-C, with a significant inverse correlation with HDL-C, and non-HDL-C, and significantly predicted cardiometabolic risk factors in a population with hypothyroidism (p<0.001) [23]. Comparable correlation patterns have been reported in previous studies, including those by Chandrika et al. [24].
During levothyroxine replacement therapy, significant reductions were observed in TC, LDL-c, and non-HDL-c levels after 16 weeks of treatment, particularly in patients with OH. These findings support existing evidence that thyroid hormone replacement improves lipid metabolism by restoring LDL receptor activity and enhancing lipid clearance [25–27]. However, no significant improvements were observed in HDL-c levels following treatment, and lipid changes in SH patients were minimal. This suggests that the lipid-lowering effect of levothyroxine is more pronounced in overt disease, while its benefit in SH remains uncertain.
The longitudinal analyses relied on unadjusted pairwise tests rather than an omnibus three-timepoint model; therefore, nominal p values, particularly for multiple comparisons, require cautious interpretation. Although complete follow-up measurements were available for all 65 analyzed patients, the exclusion of participants before analysis may limit generalizability. Thyroid function did not normalize in every treated participant by week 16, and the 16-week follow-up does not establish effects on cardiovascular events.
From a cardiovascular perspective, hypothyroidism contributes to increased morbidity and mortality through its impact on lipid metabolism [6, 7, 28]. Early identification and management of dyslipidemia in hypothyroid patients—particularly women in early and middle adulthood—may help mitigate long-term cardiovascular risk [29, 30]. Our findings support the incorporation of advanced lipid markers, such as non-HDL-c and TC/HDL-c ratio, into routine cardiovascular risk assessment for patients with hypothyroidism, as these indices better capture the cumulative atherogenic burden [31, 32]. In a large Chinese cohort of over 16,000 adults, non-HDL-c and the TC/HDL-c ratio remained associated with arterial stiffness across the full range of LDL-c levels, independent of LDL-c itself [33]. This matters clinically because a patient could have an unremarkable LDL-C on a standard panel while still carrying elevated residual risk detectable only through these ratio-based markers.
Future research should explore the contribution of genetic, nutritional, and comorbid factors to dyslipidemia in hypothyroid patients, particularly in perimenopausal women, in whom cardiovascular risk may be underrecognized [34]. Additionally, country-specific guidelines may be needed to optimize lipid and non-HDL cholesterol targets in different populations [35, 36].
Several limitations of this study should be acknowledged. The sample size was moderate, which may have limited the power to detect smaller lipid differences, especially between SH and control groups. The study combined a case–control comparison with prospective observational follow-up of the patient group over 16 weeks. Absent multivariable adjustment, the results reflect associations rather than independent contributions, and that residual confounding related to BMI and other factors cannot be excluded. Despite these limitations, the study benefits from well-defined autoimmune hypothyroidism, comprehensive lipid profiling, and results consistent with known biological mechanisms. Longitudinal p values were not adjusted for multiple pairwise comparisons, and no global three-timepoint test was performed; these results should therefore be interpreted cautiously. At week 16, TSH was within the reference range in 42 of 65 treated patients (64.6%), so biochemical normalization was not achieved in all participants.
This study suggests that overt autoimmune hypothyroidism is associated with a distinctly pro-atherogenic lipid profile, characterized by elevated LDL-c, reduced HDL-c, and increased composite lipid indices such as non-HDL-c and the TC/HDL-c ratio. These findings indicate a more atherogenic lipid profile in patients with overt disease. Thyroid function showed strong correlations with lipid parameters, reinforcing the close relationship between thyroid hormone deficiency and dyslipidemia. Levothyroxine replacement therapy significantly improved total and LDL cholesterol levels in overt hypothyroidism, supporting the importance of timely treatment for improving the lipid profile. In contrast, lipid abnormalities in subclinical hypothyroidism were milder and did not significantly improve with short-term therapy, suggesting that treatment decisions in SH should be individualized rather than based on lipid parameters alone [37]. Incorporating advanced lipid markers such as non-HDL-c and the TC/HDL-c ratio may enhance cardiovascular risk assessment in hypothyroid patients. While longitudinal studies are needed to determine whether these lipid alterations translate into increased cardiovascular events, our findings support proactive monitoring and management of dyslipidemia in autoimmune hypothyroidism to mitigate long-term cardiovascular consequences.
Chaker L, Razvi S, Bensenor IM, Azizi F, Pearce EN, Peeters RP. Hypothyroidism. Nat Rev Dis Primers. 2022;8:30. doi:10.1038/s41572-022-00357-7
Taylor PN, Medici MM, Hubalewska-Dydejczyk A, Boelaert K. Hypothyroidism. Lancet. 2024;404(10460):1347-1364. doi:10.1016/S0140-6736(24)01614-3.
Duntas LH, Brenta G. A renewed focus on the association between thyroid hormones and lipid metabolism. Front Endocrinol (Lausanne). 2018;9:511. doi:10.3389/fendo.2018.00511.
Nicolaou M, Toumba M. Lipid profile pitfalls in subclinical hypothyroidism pathophysiology and treatment. Lipidology. 2024;1(2):105-116. doi:10.3390/lipidology1020008
Albishara M, Hadid L, Haddad S. Metabolic syndrome in overt and subclinical hypothyroidism Syrian patients. Acta Med Iran. 2022;60(2). doi:10.18502/acta.v60i2.8822
Suh S, Kim DK. Subclinical hypothyroidism and cardiovascular disease. Endocrinol Metab (Seoul). 2015;30(3):246-251. doi:10.3803/EnM.2015.30.3.246.
Yun YM. Apolipoprotein B, non-HDL cholesterol, and LDL cholesterol as markers for atherosclerotic cardiovascular disease risk assessment. Ann Lab Med. 2023;43(3):221-222. doi:10.3343/alm.2023.43.3.221.
Agongo G, Raal F, Nonterah EA, et al. Non-HDL-C and LDL-C/HDL-C are associated with self-reported cardiovascular disease in a rural West African population: analysis of an array of lipid metrics in an AWI-Gen sub-study. PLoS One. 2022;17(12):e0278375. doi:10.1371/journal.pone.0278375
Hansen MK, Mortensen MB, Warnakula Olesen KK, Thrane PG, Maeng M. Non-HDL cholesterol and residual risk of cardiovascular events in patients with ischemic heart disease and well-controlled LDL cholesterol: a cohort study. Lancet Reg Health Eur. 2024;36:100774. doi:10.1016/j.lanepe.2023.100774
Mammen JSR, Cappola AR. Autoimmune thyroid disease in women. JAMA. 2021;325(23):2392-2393. doi:10.1001/jama.2020.22196.
Brenta G, Berg G, Miksztowicz V, et al. Atherogenic lipoproteins in subclinical hypothyroidism and their relationship with hepatic lipase activity: response to replacement treatment with levothyroxine. Thyroid. 2016;26(3):365-372. doi:10.1089/thy.2015.0140
Li X, Wang Y, Guan Q, Zhao J, Gao L. The lipid-lowering effect of levothyroxine in patients with subclinical hypothyroidism: a systematic review and meta-analysis of randomized controlled trials. Clin Endocrinol (Oxf). 2017;87(1):1-9. doi:10.1111/cen.13338
Wang X, Wu Z, Liu Y, et al. The role of thyroid-stimulating hormone in regulating lipid metabolism: implications for body-brain communication. Neurobiol Dis. 2024;201:106658. doi:10.1016/j.nbd.2024.106658.
Liu J, Chen Y, Ren B, et al. Alteration of lipid profile between subclinical hypothyroidism and well-matched controls: a meta-analysis. Horm Metab Res. 2023;55(7):479-486. doi:10.1055/a-2081-4599.
Luo Y, Wu F, Huang Z, Gong Y, Zheng Y. Assessment of the relationship between subclinical hypothyroidism and blood lipid profile: reliable or not? Lipids Health Dis. 2022;21:137. doi:10.1186/s12944-022-01749-0.
Genéz Yeza EN, Mir CN, Ares RM, Pedrozo WR, Bonneau GA. Prevalence of thyroid dysfunction and its relationship with the lipid profile in patients in hospital from Encarnación. RECyT. 2021;36(1):70-77.
Wang Y, Zhang SS, Lv QB, et al. Comparison of low-density lipoprotein cholesterol/high-density lipoprotein cholesterol and total cholesterol/high-density lipoprotein cholesterol for the prediction of thin-cap fibroatheroma determined by intravascular optical coherence tomography. J Geriatr Cardiol. 2020;17(11):666-673. doi:10.11909/j.issn.1671-5411.2020.11.003.
Calling S, Johansson SE, Wolff M, Sundquist J, Sundquist K. Total cholesterol/HDL-C ratio versus non-HDL-C as predictors for ischemic heart disease: a 17-year follow-up study of women in southern Sweden. BMC Cardiovasc Disord. 2021;21:163. doi:10.1186/s12872-021-01971-1.
Alarcón-González P, Sosa-López JG, Sánchez-Hernández VH, Cruz-Estrada A, Aguilar-Serralde CA, Velasco-Medina AA. Association between subclinical hypothyroidism and dyslipidemia in the obesity population. Rev Med Hosp Gen Mex. 2021;84(1):11-17. doi:10.24875/HGMX.20000017
Guo LL, Chen YQ, Lin QZ, et al. Non-HDL-C is more stable than LDL-C in assessing the percent attainment of non-fasting lipid for coronary heart disease patients. Front Cardiovasc Med (Lausanne). 2021;8:649181. doi:10.3389/fcvm.2021.649181
SCORE2 working group and ESC Cardiovascular risk collaboration. SCORE2 risk prediction algorithms: new models to estimate 10-year risk of cardiovascular disease in Europe. Eur Heart J. 2021;42(25):2439-2454. doi:10.1093/eurheartj/ehab309
SCORE2-OP working group and ESC Cardiovascular risk collaboration. SCORE2-OP risk prediction algorithms: estimating incident cardiovascular event risk in older persons in four geographical risk regions. Eur Heart J. 2021;42(25):2455-2467. doi:10.1093/eurheartj/ehab312
Khan MM, Yadav P, Arowolo S, et al. Association of non-high-density lipoprotein cholesterol with cardiometabolic risk factors in patients with hypothyroidism. Cureus. 2024;16(7):e64531. doi:10.7759/cureus.64531
Chandrika N, Devaki RN, Reshma S. Non high density lipoprotein cholesterol, a simple and reliable marker to assess cardiovascular disease risk in hypothyroid patients. Natl J Lab Med. 2021;10(4):BO05-BO08. doi:10.7860/NJLM/2021/50181.2521
Kotwal A, Cortes T, Genere N, et al. Treatment of thyroid dysfunction and serum lipids: a systematic review and meta-analysis. J Clin Endocrinol Metab. 2020;105(12):dgaa672. doi:10.1210/clinem/dgaa672.
Singh S, Dey Sarkar P. Serum lipids, tHcy, hs-CRP, MDA and PON-1 levels in SCH and overt hypothyroidism: effect of treatment. Acta Biomed. 2014;85(2):127-134.
Gluvic Z, Sudar E, Tica J, et al. Effects of levothyroxine replacement therapy on parameters of metabolic syndrome and atherosclerosis in hypothyroid patients: a prospective pilot study. Int J Endocrinol. 2015;2015:147070. doi:10.1155/2015/147070.
Patrizio A, Ferrari SM, Elia G, et al. Hypothyroidism and metabolic cardiovascular disease. Front Endocrinol (Lausanne). 2024;15:1408684. doi:10.3389/fendo.2024.1408684.
Inoue K, Ritz B, Brent GA, Ebrahimi R, Rhee CM, Leung AM. Association of subclinical hypothyroidism and cardiovascular disease with mortality. JAMA Netw Open. 2020;3(2):e1920745. doi:10.1001/jamanetworkopen.2019.20745.
Sue LY, Leung AM. Levothyroxine for the treatment of subclinical hypothyroidism and cardiovascular disease. Front Endocrinol (Lausanne). 2020;11:591588. doi:10.3389/fendo.2020.591588.
Sharma H, Kakadiya J. Different novel biomarkers involved in diagnosing hypothyroidism. Egypt J Intern Med. 2023;35:28. doi:10.1186/s43162-023-00214-3.
Lei M, Weng ST, Wang JJ, Qiao S. Diagnostic potential of TSH to HDL cholesterol ratio in vulnerable carotid plaque identification. Front Cardiovasc Med. 2024;11:1333908. doi:10.3389/fcvm.2024.1333908.
Wen J, Huang Y, Lu Y, Yuan H. Associations of non-high-density lipoprotein cholesterol, triglycerides and the total cholesterol/HDL-c ratio with arterial stiffness independent of low-density lipoprotein cholesterol in a Chinese population. Hypertens Res. 2019;42(8):1223-1230. doi:10.1038/s41440-019-0251-5.
Goyal G, Goyal LD, Singla H, Sheenam, Arora K, Kaur H. Subclinical hypothyroidism and associated cardiovascular risk factor in perimenopausal females. J Midlife Health. 2020;11(1):6-11. doi:10.4103/jmh.JMH_38_19.
Zúñiga D, Balasubramanian S, Mehmood KT, Al-Baldawi S, Zúñiga Salazar G. Hypothyroidism and cardiovascular disease: a review. Cureus. 2024;16(1):e52512. doi:10.7759/cureus.52512
Raja V, Aguiar C, Alsayed N, et al. Non-HDL-cholesterol in dyslipidemia: review of the state-of-the-art literature and outlook. Atherosclerosis. 2023;383:117312. doi:10.1016/j.atherosclerosis.2023.117312.
Jonklaas J. Hypothyroidism, lipids, and lipidomics. Endocrine. 2024;84(2):293-300. doi:10.1007/s12020-023-03420-9.